
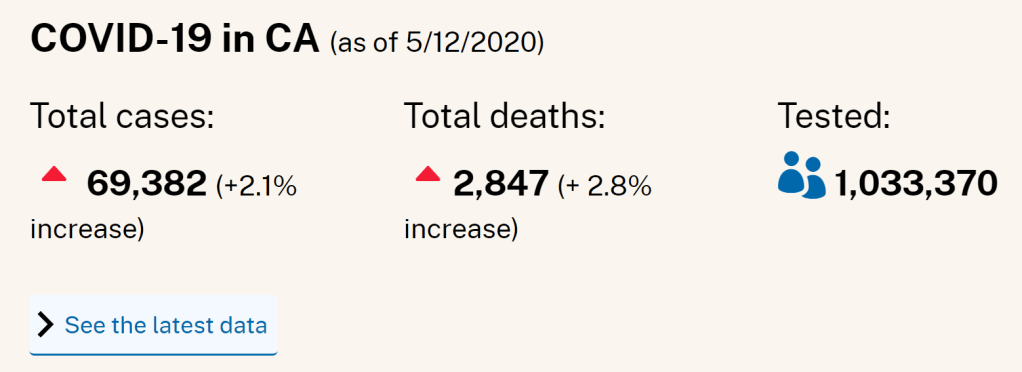
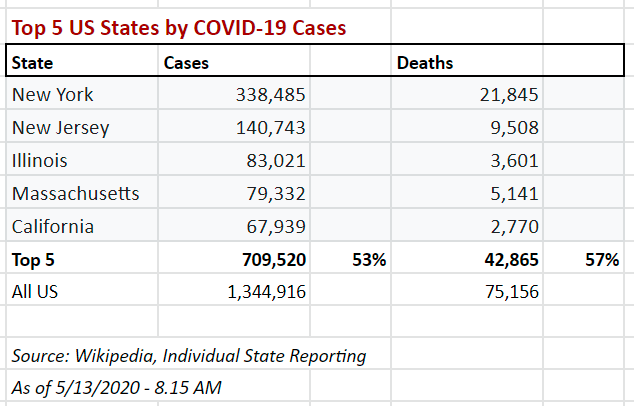
California has the 5th highest number of positive diagnoses in the US, 67,939 as of Wednesday, May 13. When combined with the four states with the most diagnosed cases; New York, New Jersey, Illinois and Massachusetts – the daily California Coronavirus COVID-19 Response shows that the disease continues to be deadly in the elderly population.
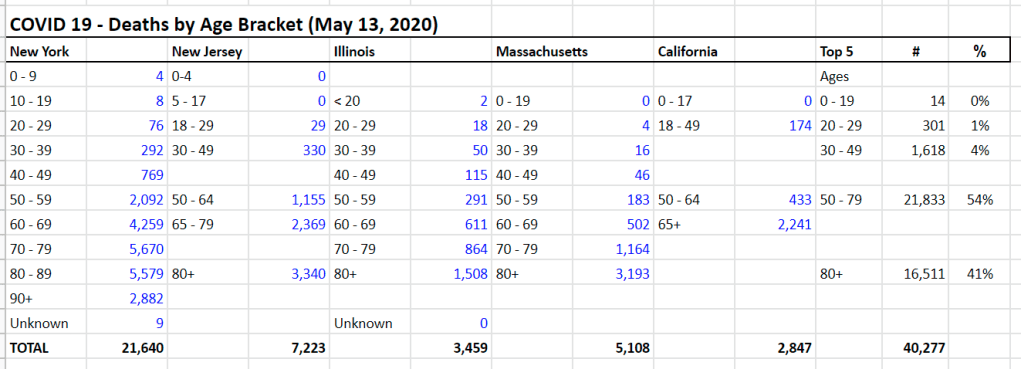
95% of deaths come from those 50 and older in the top five states; New York, New Jersey, Illinois, Massachusetts, and California.
Differences in how states report age groups make it hard to compare – the data also indicates that 85% of the deaths come from those age 60 and older.
38,344 of the 40,227 deaths recorded to date – 95% – are from those age 50 and older.
- The missing component in all of these reports is clearer visibility about the number and status of recovered patients.
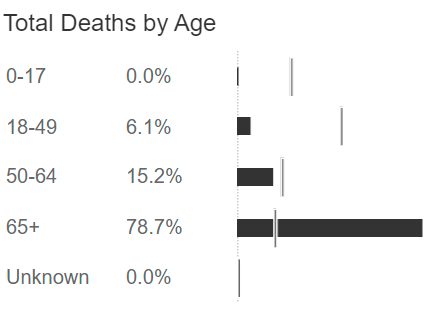
- COVID-19 kills senior citizens at a very high rate.
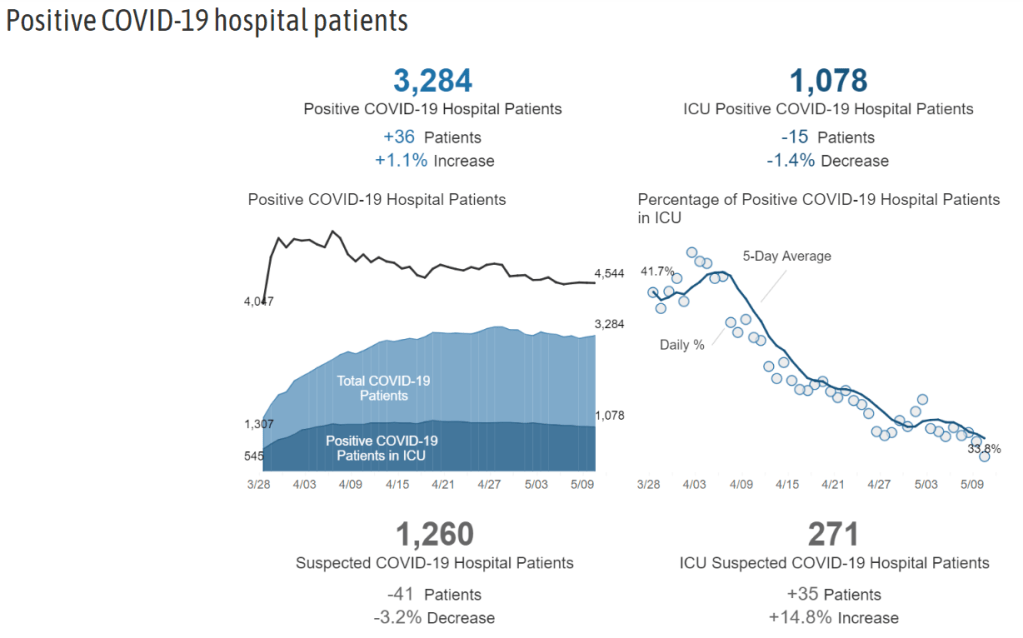
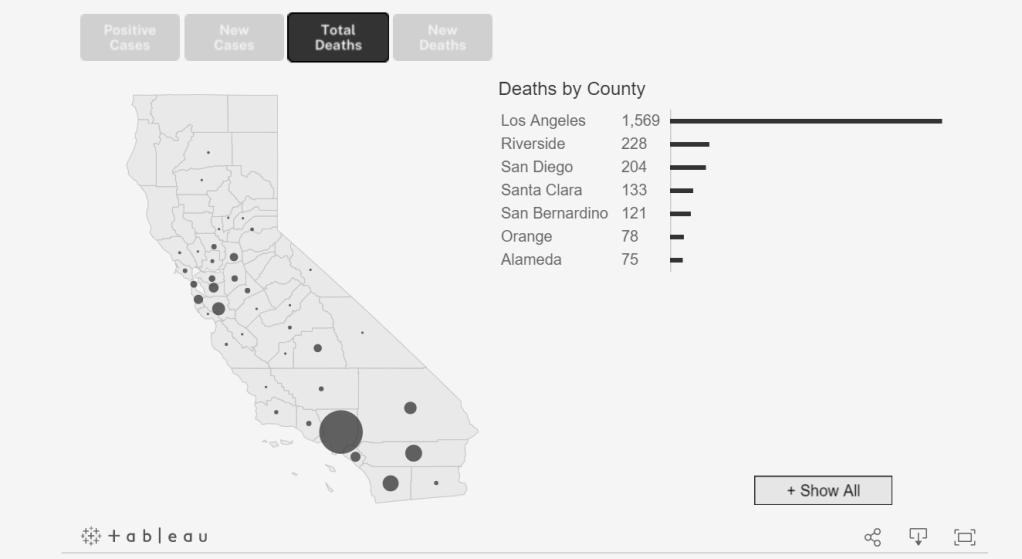
- California, compared to the top 4 states, has very good data visualization. They use the Tableau system for Covid-19 reporting.
- California, like New York, does not make it easy to access actual numbers.
- California uses the lowest number of age buckets – only 4. The buckets chosen are most similar to New Jersey.
- Like Illinois – California makes an at attempt at branding – using the taglines of ‘Resilience Roadmap’ and ‘California FOR ALL’.

95% of Deaths in New York, New Jersey, Illinois, Massachusetts and California are 55 and older


You must be logged in to post a comment.