
There is an enormous amount of confusion around Covid-19. The data is confusing. Media and personal interpretation make it more confusing. It is hard to understand what is really happening, and without knowing reality, it is hard to know how to react.
“Don’t force certainty on uncertain situations.”
Eli Goldratt – The Goal
What is the Base Rate?
Because of the rate of spread of the virus and the potential to overload hospital systems, most of the world is in quarantine. Because of all the safety precautions, fewer people overall are dying. The confusion about diagnosing the disease, detecting the disease in those who have passed away, and inconsistency in how mortalities are labeled still makes it hard to understand what is happening.
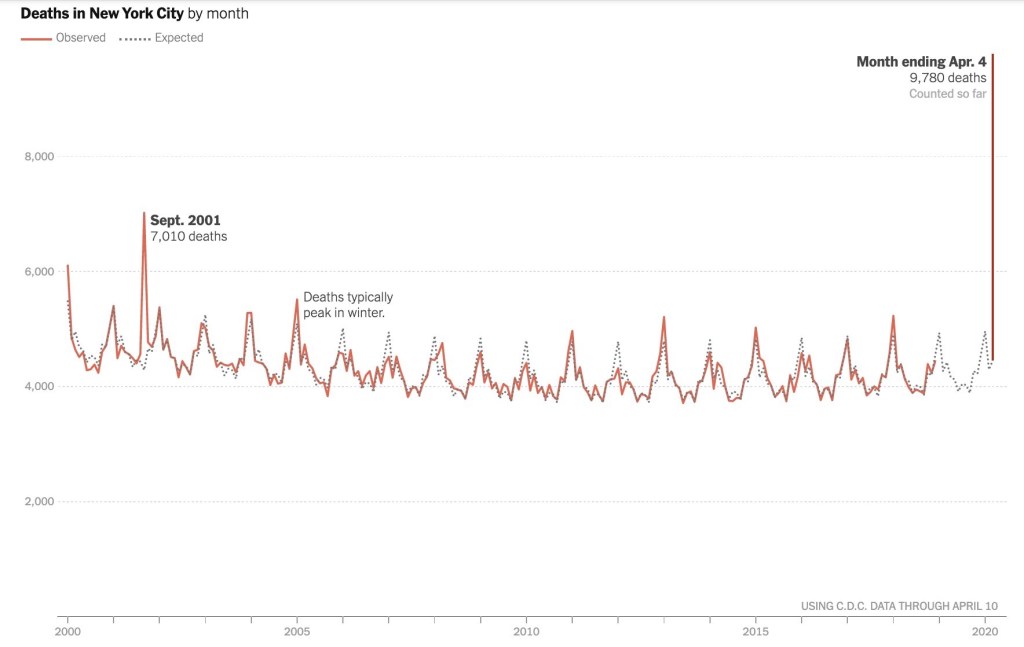
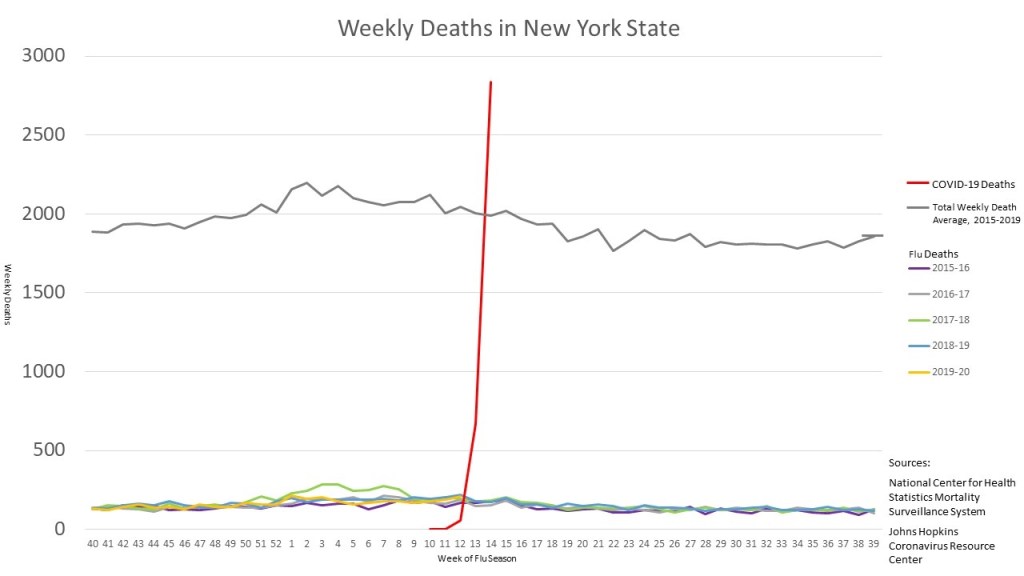
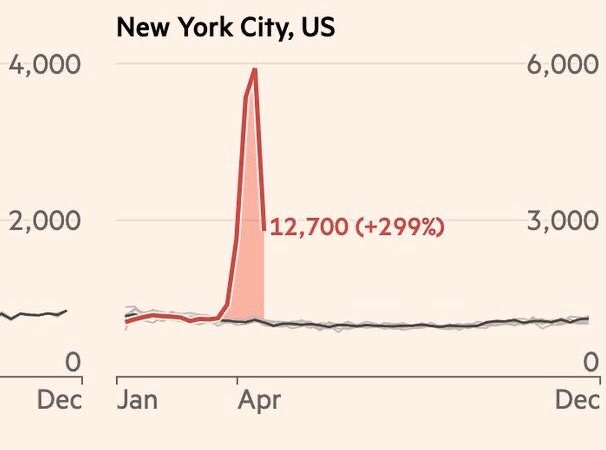
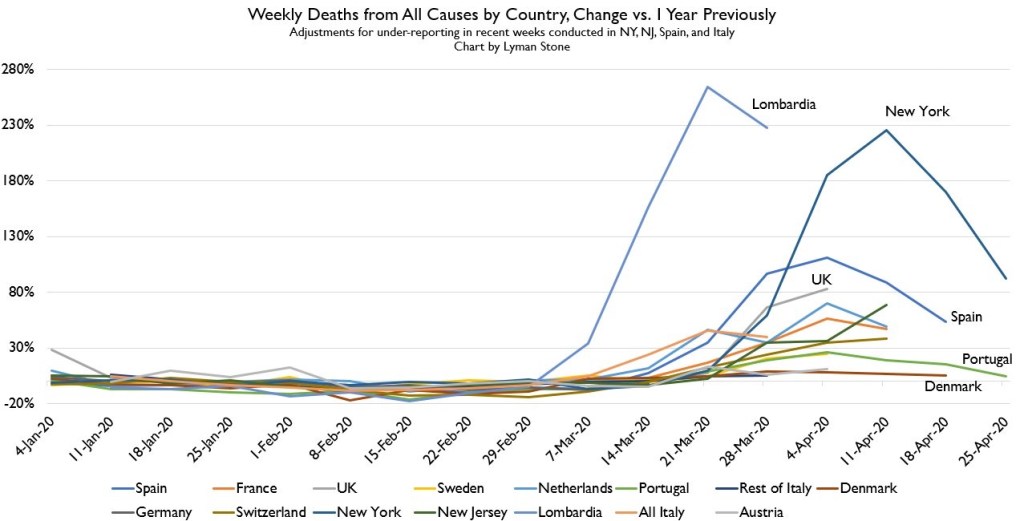
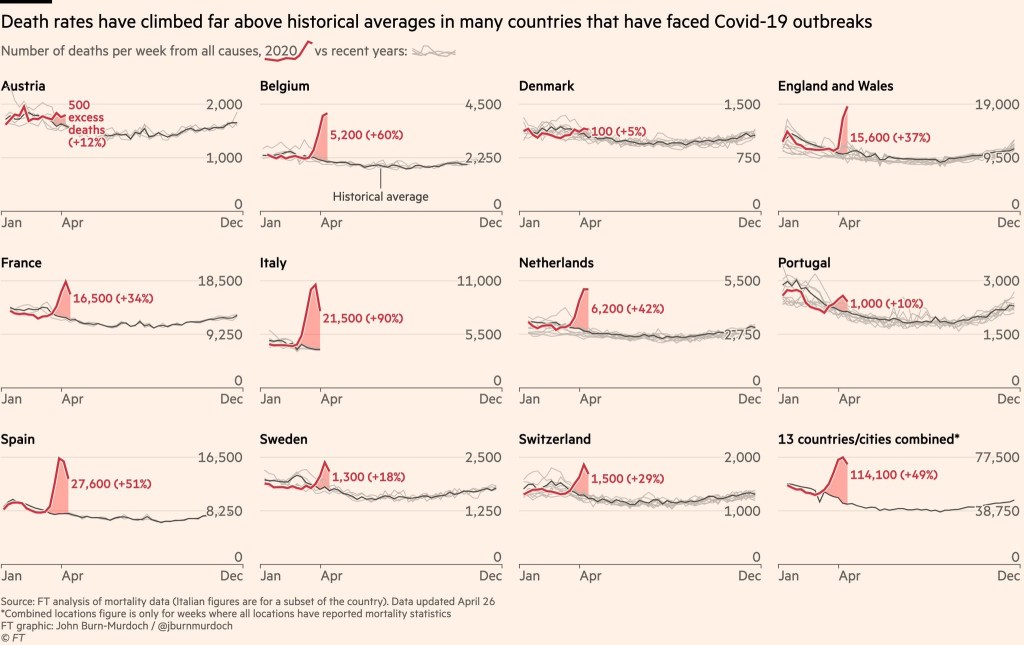
All cause mortality tracks how many people have died due to any cause – and that shows that something is happening in the population. The spike in New York City deaths has surpassed 9/11. As the charts below from the Financial Times and other sources show, several regions show a surge in all-cause mortality.
650,000 Italians died in 2019. 2,839,205 Americans died in the same year. If the citizens of both countries are sheltering-in-place, avoiding risks and less likely to die from other cuases – then any rise in ‘all-cause’ fatalities should be due to Covid-19.


You must be logged in to post a comment.