
The State of Massachusetts releases daily updates on the status of COVID-19. Slide 11 of the “Massachusetts Department of Public Health COVID-19 Dashboard” has typically covered death statistics to date broken out by age group. (Data here is from the Saturday, May 9, 2020 Dashboard.)
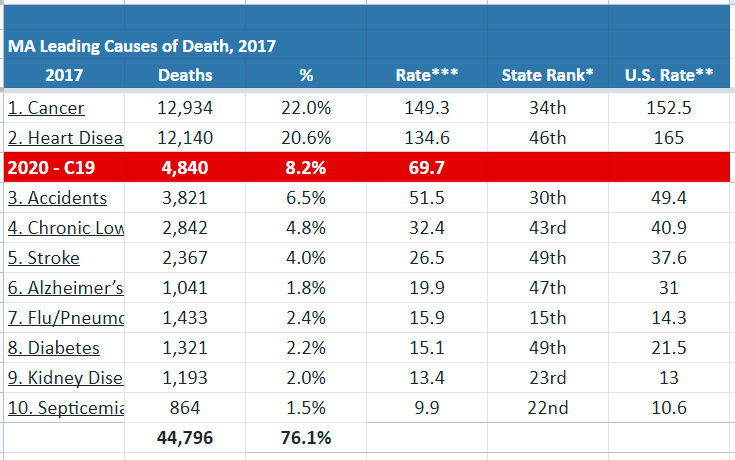
The 4,840 deaths to date in Massachusetts, when adjusted by the current population of 6,939,373 and then back to the standard method shows a mortality rate of 69.7.
Massachusetts most recent posting with thorough analysis of causes of death in the state – the ‘2017 Death Report’ can be found in the states Death Data. If the 2020 year-to-date C19 data is used as a benchmark in the 2017 data – then C19 would be the third leading cause of death, behind only cancer (149.3 deaths per 100,000 people) and heart disease (134.7 deaths per 100,000 people).
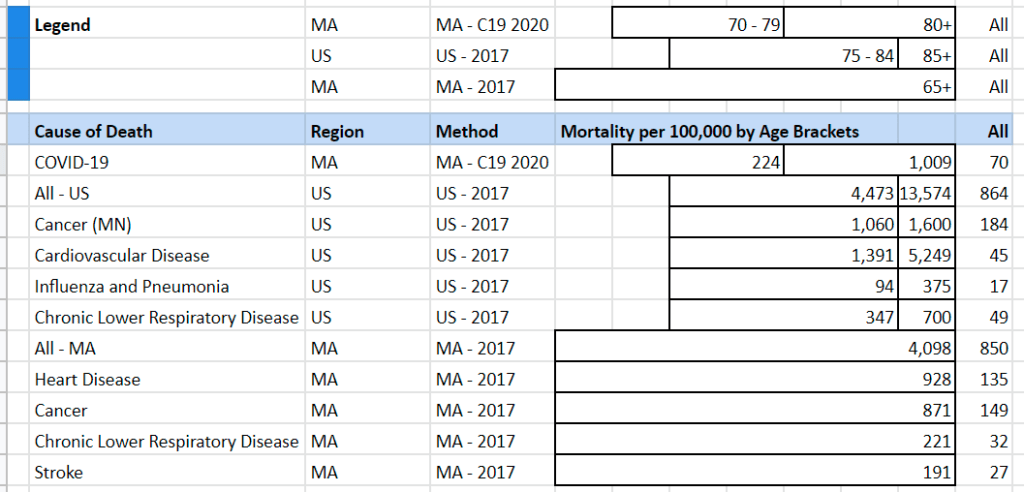
Covid-19 Mortality is Highest in 70+ Year Old Population
Massachusetts age brackets share mortality in ages 70 – 79, and 80+ as being dramatically higher for the disease. Nationally, this data is tracked in different age brackets – with the two oldest brackets being 75 – 84 and then 85+. (I’m preparing a summary of all the ways that C19 data analysis is made difficult.) The Center for Disease Control publishes an annual summary, “National Vital Statistics Reports”, and the most recent summary is the 77 page, “Deaths: Final Data for 2017“.


Pingback: COVID-19 Kills Senior Citizens: Mortality Reporting from New York, New Jersey, Illinois and Massachusetts | Fred Lybrand
Pingback: COVID-19: Website Communication from Pennsylvania, Michigan, Florida, Texas, and Georgia – Could the Florida Message be So good it saved lives? | Fred Lybrand