COVID-19: Website Communication from Pennsylvania, Michigan, Florida, Texas, and Georgia – Could the Florida Message be So good it saved lives?

Continuing to look at how states message the Covid-19 pandemic from the earlier review of the top 5 states by number of citizens with a positive diagnosis, we now look at states 6 – 10; Pennsylvania, Michigan, Florida, Texas and Georgia.

Florida’s COVID-19 mantra, “Safe. Smart. Step by step.” is so clear and supported with their protection of the elderly that it likely saved lives.

https://floridahealthcovid19.gov/

Trends

  • Florida leads the way with more of a ‘marketing style’ message. Yes, they share public health data, but their website has been hands down the clearest.
  • Florida’s messaging is so clear, and supported by the Massachusetts mortality numbers, that it changed my personal messaging – “Protect the elderly.”
  • Many states have the de facto ‘Public Health’ style update; here are the numbers, make of them what you will.
  • None of the states have made an attempt to report on ‘Recoveries’ – which would be a compelling aspect to focus on from a marketing standpoint and alignment of public incentive.

Pennsylvania – Coronavirus (COVID-19)

  • Good mapping.
  • Very few slogans, one that shows up is; “It Takes All of Us to Fight COVID-19”

Michigan – Coronavirus / Michigan Data

  • Daily data
  • ‘Public Health’ driven

Florida – Florida COVID-19 Response

  • Very clear
  • Focused on action, not data
  • Florida’s COVID-19 slogan, “Safe. Smart. Step by step.” is the clearest of any state
  • Could the power of Florida’s messaging be good enough to have saved lives?

Texas – Coronavirus Disease 2019 (COVID-19)

  • The Texas site is a bit more visually confusing – it doesn’t have the data front and center, rather the message is more about ‘opening up.’

Georgia – COVID-19 Daily Status Report

  • Georgia Department of Public Health Daily Status Report
  • This is a pure Public Health update from the get go.
Posted in COVID19, Uncategorized | Tagged , , , , , , , , , , | Comments Off on COVID-19: Website Communication from Pennsylvania, Michigan, Florida, Texas, and Georgia – Could the Florida Message be So good it saved lives?

COVID-19: Understanding Mortality Rates from California and the California Coronavirus COVID-19 Statewide Update

California has the 5th highest number of positive diagnoses in the US, 67,939 as of Wednesday, May 13. When combined with the four states with the most diagnosed cases; New York, New Jersey, Illinois and Massachusetts – the daily California Coronavirus COVID-19 Response shows that the disease continues to be deadly in the elderly population.

95% of deaths come from those 50 and older in the top five states; New York, New Jersey, Illinois, Massachusetts, and California.

Differences in how states report age groups make it hard to compare – the data also indicates that 85% of the deaths come from those age 60 and older.

38,344 of the 40,227 deaths recorded to date – 95% – are from those age 50 and older.

  • The missing component in all of these reports is clearer visibility about the number and status of recovered patients.
  • COVID-19 kills senior citizens at a very high rate.
  • California, compared to the top 4 states, has very good data visualization. They use the Tableau system for Covid-19 reporting.
  • California, like New York, does not make it easy to access actual numbers.
  • California uses the lowest number of age buckets – only 4. The buckets chosen are most similar to New Jersey.
  • Like Illinois – California makes an at attempt at branding – using the taglines of ‘Resilience Roadmap’ and ‘California FOR ALL’.
Posted in COVID19, Uncategorized | Tagged , , , , , , , , | Comments Off on COVID-19: Understanding Mortality Rates from California and the California Coronavirus COVID-19 Statewide Update

COVID-19 Kills Senior Citizens: Mortality Reporting from New York, New Jersey, Illinois and Massachusetts

New York, New Jersey, Illinois and Massachusetts represent the four states with the highest number of diagnosed cases of corona virus infection, 51% of all US diagnosed cases, and 57% of the deaths.

As a resident of Massachusetts, I’ve looked at the daily Massachusetts COVID-19 Reporting Dashboard and compared it to past Massachusetts death reports – the most recent being 2017. As we start to emerge out of the quarantine, comparisons to the other states show that the differences in reporting styles continue from state to state.

The Disease: Covid-19’s Impact

The disease is lethal to older member members of society. In Massachusetts #C19 will be the third leading cause of death in 2020 with a mortality rate of 70 per 100,000, and a rate of 1,009 for those 70 and older. The data from Illinois, New York and New Jersey show the same pattern. Each of the states also have special call outs for infections in assisted care facilities and nursing homes.

C19 gets into nursing homes and the elderly population and accelerates the rate of death significantly. This population will require special protection going forward.

The Style of Reports – Why are All the Age Brackets Different?

Ideally, these death reports would be summarized in the same way from state to state and also roll up to the CDC and Federal level in a consistent fashion. They don’t.

  • New Jersey uses different age brackets – closer to that of the CDC.
  • New York adds two age brackets that Illinois and Massachusetts don’t have – ages 0 – 9 and 80 – 89.
  • Illinois and New York have an ‘Unknown’ age bracket. Is that really possible? Is it really just ‘Not yet fully known with precision’? If we’re putting the deceased into 10 year age brackets, can an estimate be made?
  • Illinois has the only branded approach to C19, with their “Restore Illinois.”
Posted in COVID19 | Tagged , , , , , , , , | 2 Comments

Constraints to COVID-19 Data Analysis: What would the ideal report look like?

Massachusetts circulates a great daily report on C19 every day at 4 PM – the “COVID-19 Dashboard” is posted every day and contains a very detailed, 30+ page summary of the State’s Covid response reporting.

It must be very difficult to pull together these reports, and they are very thorough compared to other states. Why are they so hard to compare to Massachusett’s own annual death reports?

The ideal mortality report shouldn’t be so singularly focused on deaths from SARS-COV-19 and the Corona virus.

  • Show the daily death totals.
  • Assign every death to a category.
  • The report should be an ‘accelerated’ reporting of the annual death data, just done on a daily basis.
  • The current reporting as done is very difficult to compare to any other death reporting. Why?

Why does the Massachusetts Data look so different than other sources of mortality data?

  • The age groups are different than the State’s own 2017 mortality report.
  • The State of Massachusetts’s 2017 mortality report tracks different age brackets than the CDC shows.
  • This data can’t be fixed by downloading the raw data / information – it still doesn’t line up.

The following are all constraints in how data is reported:

  1. Lag in Data Reporting
  2. Ability to Access Data Directly
  3. Use of ‘Estimates’ and algorithms in base data
  4. Inconsistent methods and terms with current data
  5. Use of different age brackets
  6. Region-to-region variability
  7. Death definitions (included vs “due to”)
Posted in Uncategorized | 2 Comments

COVID-19 Mortality Data Comparisons Between Massachusetts and 2017 US and Same State

The State of Massachusetts releases daily updates on the status of COVID-19. Slide 11 of the “Massachusetts Department of Public Health COVID-19 Dashboard” has typically covered death statistics to date broken out by age group. (Data here is from the Saturday, May 9, 2020 Dashboard.)

The 4,840 deaths to date in Massachusetts, when adjusted by the current population of 6,939,373 and then back to the standard method shows a mortality rate of 69.7.

Massachusetts most recent posting with thorough analysis of causes of death in the state – the ‘2017 Death Report’ can be found in the states Death Data. If the 2020 year-to-date C19 data is used as a benchmark in the 2017 data – then C19 would be the third leading cause of death, behind only cancer (149.3 deaths per 100,000 people) and heart disease (134.7 deaths per 100,000 people).

Covid-19 Mortality is Highest in 70+ Year Old Population

Massachusetts age brackets share mortality in ages 70 – 79, and 80+ as being dramatically higher for the disease. Nationally, this data is tracked in different age brackets – with the two oldest brackets being 75 – 84 and then 85+. (I’m preparing a summary of all the ways that C19 data analysis is made difficult.) The Center for Disease Control publishes an annual summary, “National Vital Statistics Reports”, and the most recent summary is the 77 page, “Deaths: Final Data for 2017“.

Posted in COVID19 | Tagged , , , , , , , , , , , | 2 Comments

All Cause Mortality Data Shows C19 Impact, Right?

There is an enormous amount of confusion around Covid-19. The data is confusing. Media and personal interpretation make it more confusing. It is hard to understand what is really happening, and without knowing reality, it is hard to know how to react.

“Don’t force certainty on uncertain situations.”

Eli Goldratt – The Goal

What is the Base Rate?

Because of the rate of spread of the virus and the potential to overload hospital systems, most of the world is in quarantine. Because of all the safety precautions, fewer people overall are dying. The confusion about diagnosing the disease, detecting the disease in those who have passed away, and inconsistency in how mortalities are labeled still makes it hard to understand what is happening.

All cause mortality tracks how many people have died due to any cause – and that shows that something is happening in the population. The spike in New York City deaths has surpassed 9/11. As the charts below from the Financial Times and other sources show, several regions show a surge in all-cause mortality.

650,000 Italians died in 2019. 2,839,205 Americans died in the same year. If the citizens of both countries are sheltering-in-place, avoiding risks and less likely to die from other cuases – then any rise in ‘all-cause’ fatalities should be due to Covid-19.

Posted in Uncategorized | Comments Off on All Cause Mortality Data Shows C19 Impact, Right?

Confusion & Covid 19; Virus Behavior Driven by Human Interpretation

Thanks to the Chartstravaganza by @PlanMaestro and Germany’s Christian Drosten who directs the Institute of Virology at the Charité Hospital in Berlin for providing this background information.

Infectious disease is confusing. When Goldratt wrote The Goal, the hero Alex Rogo never wanted for good data. C19 has presented confusing, conflicting data around the goal. This calls into question measurement and observation methods. It makes decisions harder to make.

For all of the confusion that comes from the original data, we see an added layer of confusion in how this data is reported and interpreted. There are clear cases where the way in which the data is presented is driving towards a specific answer.

Case Rates

China’s case growth looks artificially flat. Presenting fatality or case rates which have not been normalized by population size seems like deliberate manipulation of data.

Flat China Data and no normalization for population size – is this legitimate data?
This data looks more useful; it is normalized by population and there is no data that ‘looks weird.’

Sweden – Good or Bad?

Sweden followed a different plan on social distancing. The graph on the left is presented to make Sweden look bad – more fatalities. The graph on the right is presented to make Sweden look good by choosing a peer group with less fatalities. The graphs below are based on the same information and presented by the same organization.

Posted in Uncategorized | 1 Comment

Facemasks, Medical PPE – How to Clean N95 Masks?

N95 masks are designed to be disposable, but supply chain troubles with the pandemic require new approaches to protect medical teams from the virus.

Below are approaches used by:

  • Duke University
  • University of Nebraska
  • Stanford University

decontaminationandreuse-1.pdf

mask-ppe-ebm-v1.2-3-25-2020-1.pdf

n-95-uv-reuse-process_nebraskamedicine-1.pdf

Posted in COVID19, Uncategorized | Tagged , , , , , | Comments Off on Facemasks, Medical PPE – How to Clean N95 Masks?

Healthcare PPE: Full Face Snorkel / Scuba Masks with Existing HME Connected with 3D Printing

For medical / healthcare professionals in need of protective gear, or perhaps without PAPR gear. Several groups have shown this approach to be valid to protecting the wearer from the disease. The images below link to a Pall element, and a past paper on their use in infection control.

Posted in Uncategorized | Comments Off on Healthcare PPE: Full Face Snorkel / Scuba Masks with Existing HME Connected with 3D Printing

FAQ on Medical PPE, Facemasks, N95, etc.

These are my personal views and not that of any employer. The best resource on this is the summary from the Smart Air Filters website by their CEO, Paddy Robertson.  If you want to approach problem solving in manufacturing – start with Goldratt.

General:

Do you know that healthcare providers and hospitals need masks?

Yes, we do! Every part of the global mask supply chain has been running flat out since late 2019, when the seriousness of the Corona virus outbreak became clear. Materials are moving through the supply chain as fast as they can.

I’d like to buy what the mask makers buy, when can I get some?

Right now, every plant I know that is part of this supply chain is running flat out. Rolled good plants can’t keep up with orders. Facemask plants can’t keep up with orders. This is an efficient supply chain with experienced, professional manufacturers that know how to get the most out of their people and plants. With the current public health emergency, most companies are not taking on new orders. The fastest way to get materials out is to follow the current path.

If a roll was sold to you, it would be like taking a mask away from a physician that really needed it.

I’m with a hospital that really needs some, can you ship me something?

Hospitals should be reaching out to distributors or to mask makers. A hospital spending its time looking for rolled good inventory is wasting its time. Focus on getting the next nearest shipment of masks.

Mask Specific Questions

I’m going to use HEPA filters since that is the highest standard – won’t that work?

HEPA is both a standard for completed filter elements used in wafer fabs, flat panel TV production, and drug making, as well as a commercial claim. For the HEPA standard, most filters are made of wetlaid glass fibers or they use PTFE – material similar to that used in Gore-tex jackets. Both of these materials have very low air permeability – healthcare workers could not breathe through them! While they would be very efficient, physicians would have to move the mask to breathe, making the whole exercise pointless.

There are commercial HEPA-claim filters (not ‘True HEPA”) that use charge to get higher efficiencies. For more on charge, see below.

I need polypropylene HEPA fibers, do you have them?

Fibers can’t have a HEPA claim – it is only used on the finished HEPA element. As discussed above, polypropylene (“PP”) is not used in HEPA.

I may have the material wrong, we are looking for the HEPA filter material that does uses a polymer instead of fiberglass?

Your options would then be to use a PTFE – which would also not be breathable. There are very small volumes of materials with synthetic HEPA on the market. They would be difficult to use in a facemask.

We’ve seen rolls marketed online, but we haven’t been able to secure any in a timely manner?

Almost every government globally is struggling to get appropriate PPE for their healthcare workers. I would not believe that a container will leave from a foreign site and get to your location. If you did receive a roll, I would expect it to be a grade that is not commercially relevant to your work.

What can we do then?

I’d follow the guidance here and make:

  • a form fitting mask
  • using two layers
  • that somehow incorporates charge –
    • Use a pocket to include a swiffer refill
    • make one of the layers wool, or some other ‘static-y’ material

American Based Manufacturing Questions

Why did all of the manufacturing go to China?

My personal impression is that the capitalist pressure to ‘maximize’ shareholder return did not line up with a common-sense appreciation that in times of needs, a culture needs to be self-reliant. Beth Macy’s excellent book Factory Man, shows how the US effectively traded the jobs of millions of Americans in exchange to help bring China out of poverty, but this trend continued to the point of absurdity.

Doesn’t that make you angry?

There are news stories about angry participants in this supply chain, but my view is that it makes me feel more sad than upset. Even now the cries of, “we don’t know how to do this in America” – c’mon. Yes, we do. It is just a skill that has been ignored.

What other products are made with these materials?

Nonwovens are used in many industries. They are used in wound care, in car production, as surfacing veils for aerospace, and as crucial components in filter elements for the production of pharmaceuticals and drinking water.

Does everyone know hospitals need masks?

Yes!  Everyone who works in the medical PPE supply chain is working overtime and doing everything they can to push masks out to the hospitals.  There is a lot of PPE still made in the US, and that includes not only facemasks, but also gowns, medical barriers, the filters used in the ICU, and the filters in cartridges.  

How does the mask supply chain work? 

There are two main parts to the supply chain:

Rolled Goods.  Rolled good makers buy polymer – mostly polypropylene – and use it to make a nonwoven.  Several layers of nonwovens are then brought together by the next step in the supply chain, to make the mask.  The efficiency layer in a facemask is most often a charged meltblown.  

Converters.  Facemask makers receive rolled goods (sometimes in rolls that are 2 meters wide and kilometers long), and then convert them into facemasks.  Surgical masks are sewn.  N95 (NIOSH masks), and their cousins R95 and P95 (where R indicates some oil Resistance and P indicates even more) are thermo-formed and are more form fitting.  

What do you think about the recent 3M news increasing output to 100 million per month?

That’s great news.  I’d interpret that to mean that a converter, with some vertical integration – 3M and others make some Rolled Goods, but not all – is now capable of shipping 100 million masks per month.  Mask makers are often the constraint in the supply chain. The automated production lines that make masks are mechanically complex and can take a long time to build. Nonwovens lines tend to be larger and are used for many different end markets. For Nonwovens lines, it tends to be more an issue of pivoting the line to make this specific kind of material, and ensuring you can hit the standards of the grade that is required.

Why is getting masks to hospitals so hard?

The supply chain started running very aggressively as demand ramped in Asia in Q4.  China is a face mask exporter, and as China shut down its production, there was a double hit to production.  US demand was called up to not only service US demand, but to also export (before Corona crossed to the US).  Chinese supply has only come back slowly, many plants there are still closed – it is not clear if they have capacity to export now.

If anything the supply shock of China shutting down prepared the US supply chain to be ready, now all that capacity is being redirected here.

What guidance would you share to help medical professionals in the event of shortage?

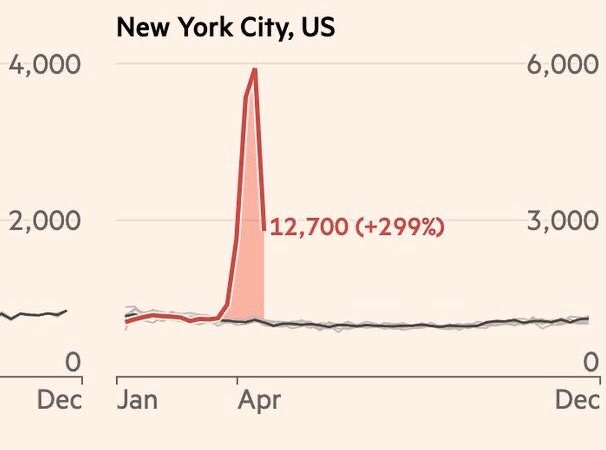
Cough droplets from patients with corona virus are a safety issue.  The atmosphere is contaminated with an unsafe particulate; cough droplets full of corona virus generated by sick patients.

  • Declare war on the droplets.  Droplets are 100 micron – 5 micron in size. Follow common indoor-air quality and safety protocols.
  • Use room air cleaners.  
  • Use whatever PPE you can.   (DysonCamfilAustin Air, etc.)
  • Never use a wet facemask – wet helps the virus travel through the mask.
  • Look for ways to get charge into the mask.

How do charged masks work? 

Charge in the fibers – static electricity – attracts the particles as they flow through the mask.  This improves the masks efficiency.  Without the charge, most masks have very low efficiency.  For very small particles – 0.3 micron and smaller, polypropylene meltblown masks only work because of the charge.  

Does the charge attract viruses to my mouth?  

No – but that’s a good question.  The charge is very weak.  Think of the dangerous particle drifting in an ICU Room – it has many forces exerted upon it.  When a mask wearer inhales, that force draws the particle towards the wearer’s lungs – rather than pass through the mask, the charge acts as a special force that pulls the dangerous droplet to contact the mask.

What materials have charge that I could use?

Swiffer replacement refills have charge.  Wool has charge.  Anything that has static electricity naturally could be useful to use.  

What steps would you suggest so this does not happen again?

MAP THE SUPPLY CHAIN. I’d make a very clear map of the supply chain. 

  • Know every hospital
  • Know every distributor that sells to those hospitals
  • Know every mask maker that uses those distributors
  • Know every rolled good / nonwoven maker that sells to those mask makers

THOUGHTFUL TECH INVESTMENT.  Ideas could include:
1. Canada had an inventory of N95 masks that had dry rotted.  Pay for a study of how to extend mask shelf lives.

2. Store inventory.  Make up fresh rolled good inventory every X years, such that it can be quickly converted to masks.

PRE-PURCHASE CAPACITY AND CAPABILITY. Pay for facemask capacity. Production equipment for masks is notorious for losing money.  Have the gov’t or other group buy equipment and pay some modest fee to have it maintained and ready for use.  

BAD IDEAS. Don’t invest in a horde of inventory.  Invest in systems and processes that can handle a future threat of unknown size and scope.  For instance, NC State was going to get a Nat’l Academy center of excellence on advanced PPE, that was never funded even though it was approved.  That would have had small volume production, but most importantly, it would have produced 100s of grad students with work experience in these fields.  As a culture we have not produced many people who can answer these questions.  

Posted in Uncategorized | Comments Off on FAQ on Medical PPE, Facemasks, N95, etc.