Tech Forecasting and Predictions – Self Blindness (5 of 7)

Reviewing past podcast tech forecast shows reveals that the hosts are very good at making predictions – but it was surprising to me that those who had domain expertise were less likely to make predictions about their area of expertise.  For instance, Patrick Beja not talking about his outlook for the gaming industry was surprising.

eyechart01

Predictions and technology forecasting aren’t easy.

Once I held myself to task and put together my own list of predictions, this hesitation made sense.

The areas where I’m most knowledgeable are technical fabrics, filtration, membranes and material product design.  However, in these domains, I did not want to go into detail at all. I didn’t want to fully share my views on the 1 year, 3 year and 5 year outlooks in those areas.  I didn’t want to give away perspective that is different than what we already have put into the public domain, and I didn’t want to share anything in this forum that might not be 100% in line with what I’ve shared with customers.

Further, like the hosts of those shows – if I’m already known as an expert in that space, there is little incentive to make statements about the future.  I can only be wrong, my reputation can only be hurt.

Posted in Uncategorized | Comments Off on Tech Forecasting and Predictions – Self Blindness (5 of 7)

Tech Forecasting and Predictions 2015 (4 of 7)

After listening to six years of tech prediction shows  – it seemed only fair to add my own predictions based on industrial and slower moving technologies.  I’m attempting to follow the rules as laid out by DTNS and the observations made in past posts.

Rules:

  1. Assume the DTNS predictions about IT and consumer level technology are true.
  2. A year for the forecast will be included.
  3. Some kind of quantitative measure must be included.
  4. Details for the forecast are listed here in Google Sheets.

Materials Science

Elmarco_INDARISE (2013_10_02)d

Materials science innovation takes 20 years per Musso.

Materials science will remain a difficult area for the lay person to understand and macroeconomic trends will continue to push investment away from this area for that very reason.  Mega mergers like Dow-DuPont will reduce spending on early stage materials sciences and academic spending will be driven towards ‘vanity’ work that leads to publications, rather than commercialization.

Prediction #00.  Materials science will continue to move at a slower pace than IT; but within the next five years (2021) increased integration across IT, computational power and documentation of existing materials shortcomings will lead to an acceleration in materials investing and discovery.

Wearables

BacktotheFuture

Wearable technology from the movies. A self-drying, self-size-adjusting jacket from Back to the Future.

The main disruptive component in wearables is the smart phone.  Innovation in smart phones will continue in a largely linear fashion; longer battery life, increased durability, increased performance.  Prediction #01: Smart phone innovation will remain on a mostly linear path through 2021 (5 years).

Easily configurable networks for wearable components that we carry with us all day long will emerge.  We see hints of this now with how different watches are bound to certain operating systems.  #P02: Within 3 years we’ll see the emergence of a primary constellation type system for devices we carry with us all the time to talk with each other.

The main drivers in other ‘wearable’ technology – smart fabrics, membranes, body sensors, etc. will be cost and performance.  #P03:  The first major market to adopt such technologies broadly will be healthcare, and that will happen within 3 years.  #P04:  Within 5 years, one of those innovations will shift out to the mass market.

Energy Storage, Vehicles, Autonomous Driving and Uber

Since their introduction in 2010 to the present, about 1,000,000 electric vehicles have been sold.  This is roughly 100% of all non-traditionally fueled vehicles, as the first mass market hydrogen vehicles introduced in 2015 are effectively at 0 units sold.  #P05: From now in 2015 over the next five years, that number for all non-traditionally fueled vehicles will jump to a total of 10,000,000.

Toyota knows more about EV and autos than most of the world; what do they know about hydrogen fuel cells that makes them so bullish?

Toyota knows more about EV and autos than most of the world; what do they know about hydrogen fuel cells that makes them so bullish?

#P06:  To get to that number of 10,000,000 total units sold will involve a combination of new technologies – including fuel cells, more expensive technologies, and their usage through vehicle sharing which will amortize their costs over more passenger miles driven. This combination will take the full five years.

#P07: An autonomous driving vehicle system will be introduced in a major global city within three years (2019) – a passenger will be able to book a ride in such a vehicle.  Google’s work with Ford foreshadows this.

A major constraint in adoption of new energy systems for vehicles (be those vehicles autonomous or owned) will be the existing infrastructure, as highlighted by this recent article on BMW and Nissan using common charging methods.  #P08: Countries other than the US who are not as heavily invested will attempt to leapfrog and accelerate adoption through policy and investment goals – this will be clear within three years (2019).  The US’s continued favoring of petroleum based fuel systems will impact this adoption the same way that it has domestic usage of drones.

#P20:  The ‘containerization‘ of individual travel – the fluidity, systems, software and hardware utilization that changed shipping, will be a dominant trend in hindsight within ten years (2026).

#P24:  There will not be an Apple Car – debate about it will be gone by 2019.

Aerospace and Drones

Drones will have their ‘Marijuana Moment’ with the FAA; states will attempt to bypass existing legislation, relax rules and promote growth while the federal government follows a different set of incentives.  #P09:  A US state or collection of states will actively ignore, promote growth, or otherwise act out of alignment with the FAA in their goal to foster this growing industry within 4 years (2020).

#P10:  Within five years, a mission will have been launched (but not yet necessarily completed) to retrieve or mine an extra-planetary object (2021).

#P11:  Elon Musk will not be buried on Mars.  (Year uncertain.)

#P12: Within 10 years (2026) a common, every day item which is of value to the individual will include components that must be manufactured or produced in low / zero gravity / orbit.

Agriculture and Food

The combination of activities listed above under ‘Energy Storage, Vehicles, Autonomous Driving and Uber’ will have a dramatic impact in agriculture.  Fully autonomous vehicles will be deployed in force.  #P13: The labor force involved in agriculture, particularly in regards to harvesting, will drop by 30% within 4 years (2020) due to the above mentioned changes.

Further, changes due to increased usage of drones, IoT and other data systems will have a huge impact in the consumption and productivity of agricultural feedstocks such as pesticides and seeds.  #P14: From a materials standpoint, consumption of these items by mass will fall by at least 30% within five years in the US (2021).

The health and wellness component of our economy will continue to drive increased visibility about agriculture and food.  #P15: Within four years a major global insurer will offer discounts for individuals who allow some degree of food monitoring, or who rep and warrant what it is they consume.

Maker Movement, Internet-of-Things (“IoT”) and 3D Printing

I’ve not been a big fan of 3D printing, but the more I talk with production sites around the world – I was wrong.  The statement below was made in January 2013 (effectively 2012) and looked out 12 years.  I think it will be wrong and may be wrong already.

My prediction is that it isn’t until 2025 that 3D printing products are in regular use in automobile lines selling over 50,000 units per year or electronic goods selling over 200,000 units per year.

1-Amzon_Echo

IoT is real; but beyond Google Nest will require another new item for mass adoption in the home.

However, I stand by my prediction that 3D printers will not ever achieve mass market consumption status. #P16: Even giving a 10 year window, US household adoption of 3D printers will never be more than 10% of the adoption of microwaves (2026).  Part of this has to do with the Uber-ization and growth of the sharing economy – part of it has to do with the limited utility of 3D printing.  3D printing remains more time consuming and much harder to do than video editing – I don’t think that will change.  #P16.1 If Best Buy exists in 3 years (2019) – it won’t have a 3D printer for sale on its shelves.

IoT will be a big deal – but it will require a ‘killer app’ to achieve its vision.  If we counted the total items in a household today and then looked at how many of them had a transistor / integrated circuit (“IC”) in them, the count is really low.  [Fewer than 5%?]  Google bought the best available Killer App.  The next one will have to be created.  #P17: The next killer app for IoT will be a new device (not the garage door opener, not the front door lock, the door bell, etc.) along the lines of the Amazon Echo, and it will exist within four years.

Healthcare and Life Science

Healthcare will also have its ‘marijuana moment’ in the US – but it will be driven by high end, top 1% of wealth individuals, who have access to treatments internationally, for which they will require maintenance services or therapies which are not yet available in the US. Or, a smaller country with more liberal views on healthcare, will make widely available at lower costs a therapy which is not otherwise available in the US.  #P18: This will occur within six years (2022).

#P19:  In 20 years the idea that someone could have their consciousness (brain, soul, etc.) downloaded onto a device or network will seem as silly then as it is today (2026).  This is the opposite of the Ray Kurzweil outlook.

#P23:  Theranos will be shown to have significantly misrepresented technical results and its technical results within two years (2018).  However, the complexity of the approval process and the technology will leave it difficult for the lay-person to explain exactly what went wrong.

Information Technology and Software

Many of the trends that have driven the growth in IT, software and the increased consumerization of technology are now on linear growth paths.  Disruptions are unlikely. #P21: Moore’s law will continue for the next 20 years.  #P22:  However, despite this continued growth – the major IT players in the Fortune 500 will be the same in 2021 as they are in 2016.  In 2026, that group will be 90% the same.

#P25: Apple Pay will win the payment space and this will be clear by 2019.

The major disruptions will occur where IT encounters other established industries.

Finance, Venture Capital and Start-ups

Investment themes, rather than individuals, firms or companies, will continue to drive returns in illiquid alternative investments.  As an activity forecasting activity for finance, venture capital, start-ups and the universe of unicorns is closer to forecasting long term interest rates, than it is a statement about current technology themes.

1-Fullscreen capture 12242015 64227 AM

Predictions and format are available as was done for DTNS past shows.

#P22: Capital flows, rather than technology trends, dictate returns for early stage investors – any decrease in Unicorn valuations (or the prior increase) within three years will show strong correlation to other, well-established, more easily tracked finance information such as interest, fixed income capital flows, macroeconomic trends or FX rates.  For example – a major devaluation in Unicorns will have more to do with valuations that were too high due to currency improvements of the US dollar and subsequent devaluations due to that over-valuation than it will have to do with the state of the actual technology and its commercial use.

Futurism & Other

#P23: If artificial intelligence occurs, we will only know of it at least five years after its first inception (indefinite).

Honesty and integrity will grow in importance for business.  Volkswagen and other businesses that have faked emissions tests will take longer to recover than currently believed.  Businesses that remove clutter and doubt about what they do and how the world really works will be more and more welcome.  #P26: The Daily Fantasy Sports industry, which has come under fire for its methods, will be substantially regulated or out of existence by 2018.  I also think of this as the ‘MMA-ification’ of business; prior to the 1993 UFC events there was much debate about what fighting style was best – after that event it was clear.  Businesses that promote and create clarity will win.

Quantified metrics will grow in importance.  #P27:  Within six years, a cost method other than miles-per-gallon (“MPG”) will be the dominant window sticker method for evaluating vehicle use prior to purchase in the US.

Posted in Aerospace, Business, Disruption, Methods, Theory, VC | Tagged , , , , , , , | Comments Off on Tech Forecasting and Predictions 2015 (4 of 7)

Tech Forecasting: Comments on 6 Years of Forecasts (3 of 7)

1-Fullscreen capture 12232015 105118 AM

Perfect forecast = Widespread Uber acceptance

Over six years of prediction shows, when the hosts were right, they were very right.  When they were wrong, it was usually because they were too early or because of a surprise event in the area they were forecasting.  Most of the big misses weren’t really misses – they were simply areas outside of what the show normally covers.  There were four areas that stood out when reviewing past podcast tech forecasting claims.

1. Forecast structure.

This is obvious, but the wording of a prediction / claim matters a lot.  “The iPhone will be big!” is much less quantitative than, “Apple Watch will not meet its 10 million unit forecast.”  Bundling forecasts makes things complex as well – “The Nook will never be more than 5% of the sales of the Kindle” assumes that Kindle will grow, but that the Nook will never achieve parity in market share.

The best predictions / forecasts were well worded.  There is a lot of insight made into things like, “The Internet of Things will have a retail app,” – but perhaps the fact that it is tough to word the forecast indicates that the forecast itself is unlikely to occur.  If it is hard to phrase the prediction, it is unlikely the prediction is ready to be made.

2.  Prediction source.

Who makes good predictions?  Over the course of the show back to 2010 there are some brilliant, highly accurate predictions.  Patrick Beja nails the Apple Watch.  Google Wave, RIM, Palm and many others were appropriately eulogized ahead of their deaths.  I could not interpret any pattern in who makes goods predictions about what field.

It did seem like experts in a field seemed less likely to make a comment about their area of focus.  JR Young – no comment on drones.  Patrick Beja – no comment on gaming.  Tom Merritt held off on Patreon prediction comments – even though he is arguably one of the world’s foremost experts on the platform.

Prediction structure appeared to matter more than the person making the prediction.

3.  Technologies not covered.

SpaceX_BlueOrigin

Predictions outside the area of the show aren’t often made.  As an example – SpaceX and Blue Origin both completed orbital recapture in 2015.

There were so many areas that were not forecast!  These Type II misses (error feels too harsh) – where a trend is occurring but there is no ability to forecast it, seemed very common.  There was never a forecast made around Tesla or electric vehicles (there was a prediction about a ‘big improvement’ in battery technology covering 2011).  No one predicted Uber.  Nothing about SpaceX.  No major predictions have been made about life science or medical technologies.

Forecasts about the start up community that is deeply tied to technology are few and far between. There is no mention of Unicorns.  There is one mention of a bubble – made by Sarah Lane in 2011.

4.  Predicting disruption.

For  the 2015 forecast show, DTNS 2397, that was published on December 31, 2014 there were predictions made about Uber related to their CEO and whether or not it would finally meet ‘general acceptance.’  I give that prediction a 100%, as Uber went from ‘not okay’ at my local RDU airport, to ‘okay’ over the course of the year.  However, Uber does not show up before that forecast.  Neither does the disruptive tethering of app infrastructure to transportation.

The bulk of the predictions made in the past shows are around the point at which technology becomes consumer ready.  This makes sense given that is what the shows cover every day all year long.  Many of the trends being forecast are at the cusp of end consumer adoption – the debate becomes, “is this the year?” or, “will this die before it fully matures?”

The crew correctly forecast all of the building blocks that let an Uber happen – the growth in the app store, the increased market share of the iPhone, even the fact that the iPhone itself would be the winning platform.  These trends were capitalized on by an Uber to pursue a market that is not a historical area of focus for DTNS.

To make use of these prediction shows to anticipate disruption, a few rules could be followed:

  • Assume that they are right about IT, consumer and near-consumer adoption.
  • Certain domains outside the normal coverage of the show are likely outside the area of prediction.
  • Assume that the predictions made about IT will combine with whatever predictions and technology roadmaps exist in areas outside of those predicted on the show.
Posted in Disruption, Industry, Invention, Theory | Tagged , , , , , , , , , | 1 Comment

Tech Forecasting: 6 years of DTNS / Tom Merritt Outlook (2 of 7)

“Whoever checks to see if these are right?” – Tom Merritt, 2014 / DTNS 2396

DTNS = Daily Tech News Show; a top podcast for listening to a recap of current tech news.

End of year tech podcasts are full of tech forecasts for the coming year.   Looking back at six years of podcasts involving DTNS host Tom Merritt, I listened to a little less than 4 hours of podcasts covering the years from 2010 – 2015.  I started the work following the ‘value-for-value’ ethos of the show; I like tech forecasting and wanted to help make it easy to do a year end wrap-up for 2015.  However, curiosity led me to listen to past shows.  My goal here was to; (1) think of frameworks that could be useful in tech forecasting, (2) see what trends emerge in these specific forecasts and (3) review how much technology has moved since the start of this decade.

d

Six years of tech forecast year-end podcasts.

Method

  1. Listen.  This was easy enough – all of the source shows were available on line.
  2. Listening to an Outlook (Forward) Show.  The first episode I listened to was DTNS 2397, which was recorded in 2014 and forecasting what would occur in 2015.  My notes for this are in a previous blog post.
  3. Listening to a Recap Show. Recap shows are made at the end of a year and discuss how well past forecasts did to anticipate the year’s major events.  For example, DTNS 2396 was broadcast in 2014 and was a recap of forecasts made during Tech News Today 911, which was broadcast originally on December 26, 2013.  DTNS 2396 (2014), TNT 910 (2013), TNT 658 (2012), TNT 401 (2011), and TNT 147 (2010) are all Recap shows. These shows were easier, as at that point the hosts had done some degree of quantification of their past forecast.  (A Google Sheets summary is here.)
  4. Document claims (aka forecasts).  I used the same methods that I’d done in DTNS 2396.  Claims were made in a big bucket list, and if sub-claims were verbalized, I would add them too.
  5. Document sub-claims.  On the tab ‘Claims 2010 – 2015’, I listed everything I could decipher going back to 2010 claims.  For example in 2010 Becky Worley made the very early observation that the megapixel race on cameras was dead – but that it was alive and real for your phone.  Those two claims are separate sub-claims in this document (row 257 and 258).
  6. Who?  Over the years there have been multiple participants – I attempted to document the original source of the claim wherever possible.
  7. Result.  I am by no means capable of quantifying the current state of technology. However, I did my best to state if a claim was true or not in the current year of 2015.

What can we learn?

There were several categories of lessons to take from this review:

  1. Claim Structure Matters.
  2. Accuracy of Claims.
  3. What is not covered?
  4. Disruptive Claims.
Posted in Uncategorized | Tagged , , , , , , , | 1 Comment

DTNS 2397: Tech Forecasting for 2015 (1 of 7)

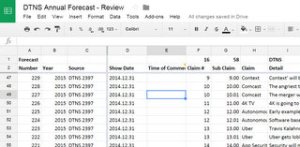
In the value-for-value world of DTNS, Patreon and Tom Merrit – I might not be the best contributor.  Trying to think of ways to give back, I listened to the 2015 forecast show, DTNS 2397, that was published on December 31, 2014 and took the following notes to make it easier to produce this year’s 2015 Forecast Recap show.  Attached is my Google Sheets summary – hopefully it is useful and saves the team a bit of time in putting together the recap.

1-Fullscreen capture 12202015 15130 PM

My efforts to track the claims, sub-claims, initiators and supporters of the 2014 DTNS forecast show for 2015.

I love this show.  There’s something about the combination of the holidays, the annual nature, the free-flowing dialog, and everyone of the participant’s interactions that make it really interesting. I love podcasts; the medium is very effective and valuable.

My method was simple:

  1. I listened to the show.
  2. I entered what I heard into a Google Sheet. [I did not track when during the show this claim was made, but I left a column open for it in Column E.]
  3. I called a formally made forecast a ‘Claim’.  The primary claim is listed in Column F.  I counted 16 claims for the 2015 outlook.
  4. Once a claim was made, there was usually some secondary discussion – much of which was around trying to quantify or firm up how the claim could be judged to be true.  Column G track sub-claims and Column I attempts to track detail.  I counted 58 total claims.
  5. The person who made the forecast was listed with a ‘1’ in columns K-S.
  6. I tried to indicate who else that was on the show that supported the forecast in columns.  I used a 5 point scale (aka “I totally agree!” = 5/5. )  This got tricky with disagreement; should that be a 0 or a (-5)?  I went with a 0.  So, Patrick Beja’s disagreement that Spiderman would *not* re-enter the MCU was a 0.
  7. I attempted to grade the score from the 2014 forecast for 2015.  This was really an attempt to help out with the show – I am not an expert on these fields of technology so I had to go look things up.  (Yes, I do not use Snapchat.  Yes, I had to go confirm that it was still an independent company.)  The 2015 forecast outcome accuracy is listed in Column AD.
  8. Lastly – Esteemed producer Jenny Josephson judged the 2015 forecasts.  This was measured in two ways; (1) the contents of a DTNS coffee mug, and (2) what % full of the contents were said mug (Columns X & Y).

As an example; Patrick Beja initiates a forecast about the Apple Watch – I call that claim 2.  As the dialog continues, several sub-claims are made, resulting in Tom’s comment that predicts that there will be an article on TechCrunch saying that the watch is now in a drawer.  I call that Claim 2.05 (I used 0.01 increments on sub-claims – ala Dewey Decimal methods).  Since that article actually exists – I give it a 100% in column AD (but that column is really meant for the show participants to update).

Posted in Business, Disruption, Innovation, Invention, Methods, Theory | Tagged , , , , , , , , , , , , | 1 Comment

Methods: To Do List

1-IMG_6998

Activity tracking and note taking improve when they are separated into different activities and methods.

In June of 2015 I was overseas looking for 3″ x 5″ notecards – at the time they were the basis for my task tracking method.  No luck.  None were found.

Finding the store shelves empty of the preferred method – I grabbed a classic reporter’s notebook which was spiral bound at the top.  The methods I’d been using transferred easily to a single page in the notebook:

  • Keep only a single day’s to do list
    • This forces prioritization by limiting the number of items (18 in my current notebook)
  • Indent each item, then make;
    • Hashmarks to indicate progress towards completion
    • X = work is done
    • M = Moved to a future day
    • D = Duplicate item (unfortunately pretty common)
  • Use the back of the list to track a ‘Has Done’ list – this confirms what did get done that was off the list
  • Throw out the list at the end of the day
  • All day long there is a centralized list to:
    • Track must-do items
    • Add newly identified items
    • There is no need to dig through meeting notes to find deliverables
Posted in Methods | Tagged , , , , , , | Comments Off on Methods: To Do List

Methods: Notes in Meetings

1-IMG_6921

Simple 60 page notebooks help me stay organized, track meeting action items and keep our team on task.

In my first job I was handed a typical banker’s notebook and told that taking good notes was part of my job as an analyst.  Exhaustive notes were important.  Through promotions and a career switch to technology, those same notebooks and methods followed me. Simple banker’s notebooks were replaced with basic engineering graph notebooks or composition notebooks.

Briefly after graduate school I tried using Circa.  The notebooks were novel, the product was very nice, but it wasn’t as effective for me as a simple, standard notebook.

4-IMG_6996 2-IMG_6994
Note taking for me is more about active listening and using my notes to make sure that the meetings or events that I’m part of are as effective as possible.  It is less about the analyst assignment of taking exhaustive notes – more about making sure that meetings creative effective decisions and that the right actions follow.

In a typical year I’ll go through 5 – 7 sixty page dot grid notebooks.  Somewhere I picked up the habit of a standard set of initial appendices and conclusion pages.  These notebooks are not used for action items; that is a different method and for that I use disposable reporter’s notebooks and deliberately don’t keep the output.

3-IMG_6995Notebook goals are:

  1. Record events.  Use paper to listen actively while letting the meeting flow and encourage participation.
  2. Plan for meetings, calls and events.
  3. Plan the year, and a rolling 24 month outlook.
  4. Record and distribute action items, strategies and conclusions from meetings.
  5. Make sure the team has balanced participation in meetings.
Posted in Methods | Tagged , , , , , | 1 Comment

RTP Job Search 101: Raleigh, Durham, Chapel Hill, Cary, etc.

RTP is a great place to live and work – the region and economy are growing, work life balance is good and there are many top tier employers.  Through Elmarco‘s work with the NC State University College of Textiles, Nonwovens Institute, RTI, and our broad spread of academic ties in the Southeast, we get a lot of questions from people who are looking to relocate to the area.

Finding a job here is really no different than finding one anywhere else...Many of those inquiries start with, “What is the best way to do a search for positions in RTP?”  Here’s the advice we pulled together.  Most of this works for any kind of prospecting activity, regardless of location.

  1. Have a target.  A mentor of mine once said, “There are three things that matter – what you do with your life, where you do it, and who you are with.  Figuring out your own order is as important as the answers.”  If you are networking here, have some kind of target – either an industry, a company or part of the region (it is very big) that you can focus on.
  2. Be here.  A good local networker will find something faster than the greatest recently minted Harvard or Stanford MBA with a sterling work history.
  3. Connect with the connectors.  Startup Factory has regular events in central Durham.  There are many startup and entrepreneurial events from Raleigh all the way to Greensboro (technically the Piedmont Triad, not RTP).  Many of those are a waste of time.  However, at those events are the investors, accountants and lawyers who know what businesses are growing and in need of talent.  Find those people who are naturally screening many opportunities through their daily business.
  4. Be flexible.  The balance to #1 above is to recognize if you are achieving your target.  If you aren’t, or if no one can help you find a relevant business that fits your ideal, then it is time to re-prioritize.  During my previous work in private equity we would methodically explore a thesis and categorize everyone who is in the space – we would sometimes encounter people looking for something that did not exist, but didn’t realize that their search could not be fulfilled.
  5. Be patient.  Time is part of being successful in any kind of search – the more you have, the more likely you are to find the right match.  I’ve watched many people who have relocated to the area take something quickly, then shape their life, commute and family around a position that wasn’t optimal.
  6. Persist.  Similar to #5; if you quit after 6 weeks then you will simply be joining the long list of itinerant looky-loos who knock on a few doors but are just exploring the area.  There’s nothing wrong with that, but beginning this search without the right frame of mind won’t result in success.
Posted in Uncategorized | Comments Off on RTP Job Search 101: Raleigh, Durham, Chapel Hill, Cary, etc.

Vendor Selection: What Works

The Bay Bridge’s Newest Section

The California DOT’s selection of a partnership with Fluor and Shanghai Zhenhua Heavy Industry Co., Ltd. (“ZPMC”) to build the new section of the Bay Bridge hasn’t gone well.  It isn’t easy to chose the right partner for a unique project, there are some standard steps CDOT likely followed prior to picking the Fluor-ZPMC partnership.

Site Visits

I assume that CDOT personnel spent plenty of time in Shanghai with ZPMC and their partners, Fluor.  Getting to know a business at their site, reviewing their quality systems and developing relationships with their people are the best way to understand if they could really deliver what was needed for the bridge.

Partnership Audit

How long have Fluor and CDOT worked together?  Who are the key personnel?  How well do they know each other?  Do they have personal relationships outside of the office?  These are tough things to understand and this would usually be considered outside of the boundary of a standard investigation of a vendor, but with a project like this and a partnership with the dynamics of Fluor and ZPMC, it would be essential to understand what the dynamics really are when buying from this group.

Most Favored Nations Clause

A most-favored nations clause usually states that, “what we agree to here will be the best type of terms we agree to with any customer; and if not, we will offer any better terms that are offered.”  For most customers, this is a concern about price – they don’t want to pay top dollar for a system that they find out was sold to someone else for less.  However, this can be extended to items like service response times, quality yields, etc.  Even if it isn’t agreed to, by asking for it CDOT would trigger serious conversations from their vendor – the kinds of terms that Fluor and ZPMC granted to Greater Gabbard on their wind farm would have gone a long way to making CDOT whole for the pain of the faulty welding.

Capability Review

weldsZPMC wasn’t capable of performing the welding needed by CDOT in the volume that was required by the project.  A basic capability review of the vendor would likely have uncovered this.  Further, the welds were to have been tracked in quality systems that weren’t up to par.  A systematic review of the methods needed would have uncovered the weaknesses experienced by both the wind farm and bridge construction projects.  Asking someone, “can you do this welding with the right quality?” will get the answer that passes the question.  Spending several weeks on site and reviewing their current welding and quality recording projects would get a real understanding of what they are currently doing.

A Second Project

Neither the wind farm group nor CDOT will likely work with ZPMC ever again – and in this situation they lose a lot of their leverage.  The potential for a second project would bring ZPMC and Fluor back to the table to address the problems that they’ve had so far.  In fact, it may be the possibility of future wind farm projects that keeps the North Shore engagement on fairer economic terms (these projects may be fundamentally a better fit for ZPMC’s capabilities).  Fluor likely has more incentive since they are most likely to be looking at additional, similar projects.

Conclusion

There are many ways to understand if a vendor’s capabilities will really deliver what you need.  The true costs of bad vendor selection for these kinds of custom projects are far beyond the costs of more diligence on the part of the buyer.  CDOT will spend money for decades repairing this work when it would have been much cheaper to choose the vendor more carefully in the first place.

Posted in Industry, Marketing, Theory | Tagged , , , , , , | Comments Off on Vendor Selection: What Works

Vendor Selection: The Bay Bridge

Choosing the right vendor is never easy.  The California Department of Transportation’s recent woes with the $2 Bn updated suspension span segment that was overseen by the US construction firm Fluor and physically built by Shanghai Zhenhua Heavy Industry Co., Ltd. (“ZPMC”) illustrate some of the challenges in choosing your partner in long term projects.

It is not easy to figure out who to work with in these situations:

  • How do I know who can do this project if it has never been done before?
  • How do we contract with each other in the case we encounter unforeseen problems?
  • How does a customer run the vendor evaluation process to get the right outcome?

There aren’t any perfect answers.  In a perfect world, CDOT would circulate an RFP and there would be 50 companies who had built identical bridges with long track records that are easily audited.  The competition under this scenario would be dictated by price.  Unfortunately, classical economics don’t work here.  CDOT has a unique site with unique time and other needs.

To choose the right vendor they needed time to develop trust in the vendor.  With enough time and exposure, they would understand what the vendor can and cannot do.

Time would allow ZPMC to fully understand what CDOT’s needs really are and whether or not a relationship with Fluor could help them achieve their goals.  From ZPMC’s standpoint, signing up for a project where they can’t deliver doesn’t help their interests – it only creates an installation that can’t be supported.

Unfortunately, it doesn’t sound like there was enough time for all of the parties to truly understand what they were getting.  ZPMC hasn’t met the quality and reporting needs of the bridge.  Welding methods that were needed weren’t followed correctly.  CDOT may have gotten a deal on the bridge, but the service and maintenance costs will be far beyond their initial estimates.

Posted in Uncategorized | Comments Off on Vendor Selection: The Bay Bridge